Blue Cities in Red States
Is there a relationship between which states are recording rapid employment and population growth and which political party dominates in those states? Growth has tended to be in warmer parts of the country, and many of those Sun-Belt states tend toward Republican voting.
County level maps for the 2020 presidential election reveals concentrations of Democratic voting in southern states that had mostly Republican-voting counties. And those Democratic-voting clusters are generally the states’ denser population areas. In some states the population in metro areas comprises over half the state’s total.
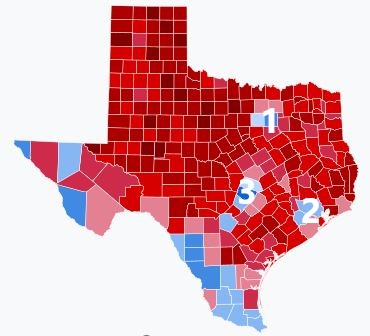 Texas, with its 254 counties, is a case in point. Counties colored in red on the Texas map voted for Donald Trump in 2020, and counties in blue voted for Joe Biden. (Maps of each state were produced for Wikimedia Commons. Click to enlarge maps.) The state has three metropolitan areas of one million population or more. They are Dallas-Fort Worth-Arlington (#1 on the map), Houston-The Woodlands-Sugarland (#2), and Austin-Round Rock-Georgetown (#3). The state’s population increased by 15.9% between 2010 and 2020, while the three metropolitan areas’ total population increased by 21.1%; the non-metropolitan areas increased 9.3%. The metropolitan areas’ share of state population increased from 56% to 58.5%.
Metropolitan area growth may explain changing voting patterns at the level of state elections. Greg Abbott was first elected Texas governor in 2014 by a margin of more than 20%. In 2018 he won a second term by just over 13%. His margin in 2022 was 11%. Along the state’s southern border, Democratic candidates unexpectedly won two of three open seats. Trump won the state by a margin of 5.6% in 2020.
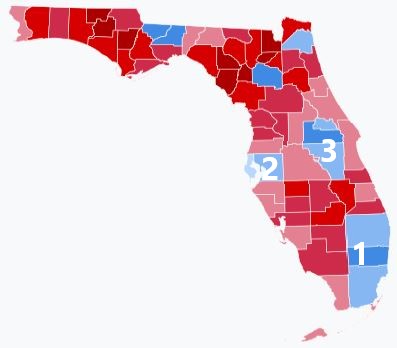 Florida represents a slightly different situation. It has three metropolitan areas of one million or more people: Miami-Fort Lauderdale-Pompano Beach (#1), Tampa St Petersburg-Clearwater (#2), and Orlando-Kissimmee-Sanford (#3). They represent 63.1% of the state’s population. The metropolitan and non-metropolitan rates of growth were practically the same. Trump’s margin of victory was 3.4% in 2020.
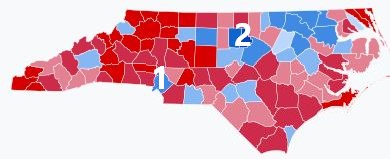 North Carolina has two metropolitan areas of one million people or more. They are Charlotte-Concord (of which 15% is in South Carolina, #1 on map) and Raleigh-Cary (#2). The metropolitan areas grew at more than double the rate of the state as a whole, and in 2020 represented 35% of the state. Trump won North Carolina by 0.34%.
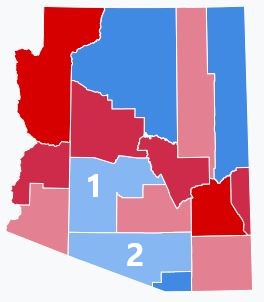 Two states that Trump lost by very narrow margins in 2020 had their results contested by the Republican Party (and Fox News). Arizona’s two metropolitan areas of one million or more population are Phoenix-Mesa-Chandler (#1) and Tucson (#2). The two together grew by 13.6% between 2010 and 2020, somewhat faster than the state’s 11.9%, and nearly three times the rate of the non-metropolitan areas. The metropolitan areas in 2020 comprised over 82% of the state’s population. Biden’s margin in the 2020 election was 0.3%. The state’s county configuration creates a unique pattern, with a few large low density counties voting democratic.
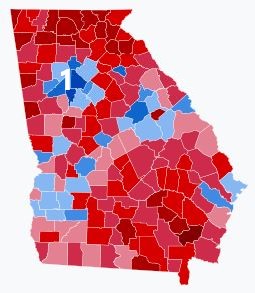 Georgia has one metropolitan area, Atlanta-Sandy Springs-Alpharetta (#1 on map), with a population over one million. The metro area grew over 15% between 2010 and 2020, three times the rate of non-metro areas. In 2020 the metro area comprised just under 57% of the state’s population. Biden’s margin of victory in Georgia was 0.23%.
David Brooks, in a recent opinion piece in the New York Times, questioned why the fastest-growing states were mostly red. Are people attracted to Southern states by their lower taxes and cost of living? By lower energy costs? By friendlier business climates? On further analysis, he noted that the growth was not occurring in the “red” parts of the red states, but in the large metropolitan areas. “Republicans at the state level provide the general business climate, but Democrats at the local level influence the schools, provide many social services and create a civic atmosphere that welcomes diversity and attracts highly educated workers.”
Are the metro area voters conservative on economic issues and liberal on social issues? If so, what can be expected of state-level politics as metro populations become ever-larger shares of state populations? All five of these states, including the two that voted for Biden in 2022, have Republican majorities in both houses of their state legislatures. All except North Carolina have Republican governors. Recent voting patterns suggest demographic changes are linked to shifts in party control at state level.