Inequality Tracked Through Six Decades of Graphs – Part 2 of 2
This is Part 2 of 2 posts about shifts in the U.S. economy and society. Part one reviewed distribution of income and wealth among families, household inequality, worker pay vs productivity and CEO pay, and union membership.
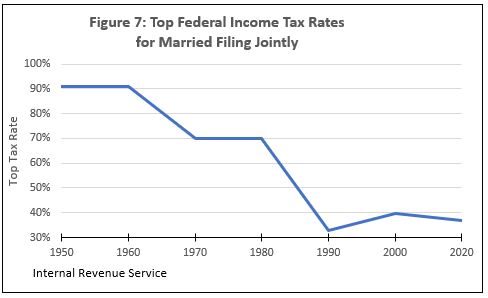
Changes in the Federal income tax rates over the last 70 years have had a negative impact on income inequality. The U.S. has a progressive income tax, which means that the highest rate of taxation on income applies to the highest income earners.
Since 1950 the top rate paid by high-income families has decreased by over half, from 91% in 1950 and 1960 to 37% in 2021, enabling those earners to accumulate wealth more quickly.
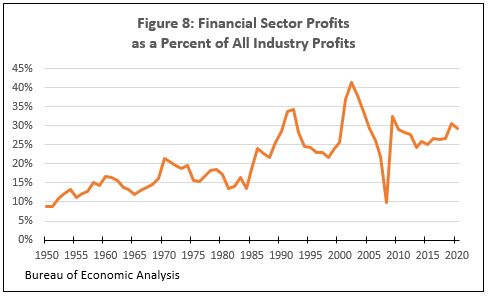
An interesting take on a sector particularly advantaged by U.S. economic decisions is how the financial industry has benefitted. Divested: Inequality in the Age of Finance, a 2020 book by Ken-Hou Lin and Megan Tobias Neely, describes the immense growth in financial sector profits as a percent of all corporate profits.
Figure 8 shows the financial sector’s share of profits increasing from 8.8% in 1950 to a peak of 41.2% in 2002. The Great Recession abruptly reduced the share to 9.9%, followed by recovery to around 30%. Profits are derived from the transfer of money and monetized assets. Workers in the sector typically have at least a four-year college degree, with salaries around 70 percent above average worker pay.
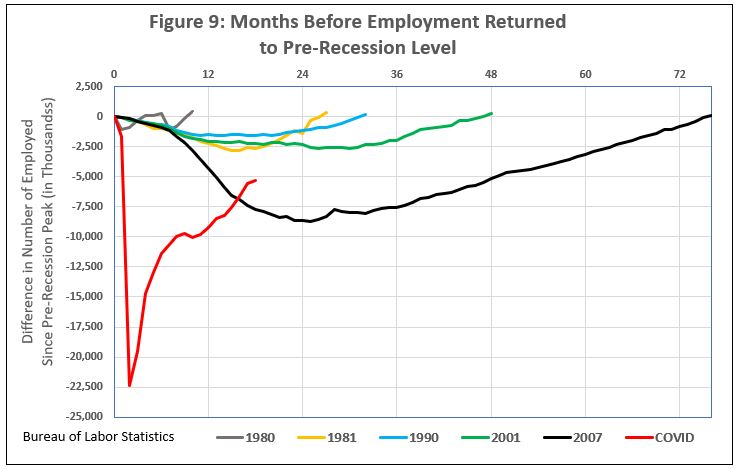
Recessions occurring since 1980 have been noteworthy for their increasing length. Figure 9 displays six recessions since 1980 and the number of months before pre-recession employment levels were restored.
Employment was restored in ten months after the 1980 recession began, and jobs took longer to recover after each successive recession. (The current recession has yet to reach pre-recession employment.) Looking at data for the Great Recession of 2007, the impact on types of workers was uneven. Service worker unemployment peaked at 11.4% and sales worker unemployment peaked at 10.2%. The highest unemployment rate among management and professional workers was 5.5%.
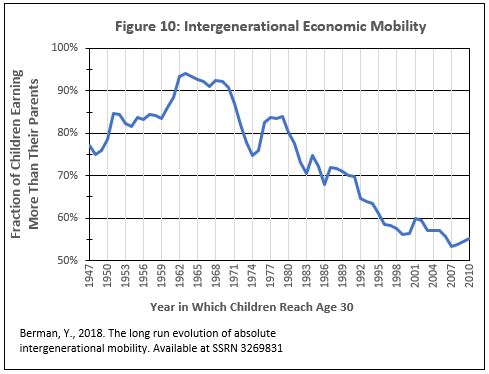
Despite the increasing inequality documented in these nine graphs, parents hoped for better jobs and higher income for their children. Figure 10 illustrates that for the immediate post-war period that hope was realized for an increasing portion of the population.
A study by Yonatan Berman of the City University of New York tracked economic mobility by measuring the percentage of 30-year-olds who were earning more than their parents. In 1947, 77% of 30-year-olds were earning more than their parents. In 1963 that number had increased to 94.1%. Then between 1963 and 2010, the last year of the study, this measure of intergenerational inequality had decreased to 55.2%.
Together, these ten graphs present a consistent pattern of trends contributing to inequality, starting around 1970. A longer term view, described in The Upswing: How America Came Together a Century Ago and How We Can Do It Again, places inequality in a context that follows the rise and fall of social cohesion in the United States starting around 1890 and continuing until today. That book, written by Robert Putnam and Shaylyn Romney Garrett, points to the 1960s as a cultural turning point. The decade began with post-war optimism and a booming economy that promised prosperity for all. The second half of the decade was marked by Vietnam war protests, political assassinations, urban unrest, student protests, a drug epidemic and more, what the authors called “something like a national nervous breakdown.”
The authors view the progressive era leading to the 1960s representing rising interdependence and cooperation. They call the following period, covered in Figures 1 through 10 above, “a steep descent into greater independence and egoism” continuing until today. The authors fault the early 20th century progressive era for not setting its sights high enough in achieving full inclusion and addressing racial and gender inequalities. Achieving inclusion and addressing inequality sound like worthy first steps to reverse these socially destructive trends.


